
Use Cases 
Formatted Strings Logging Over UART 
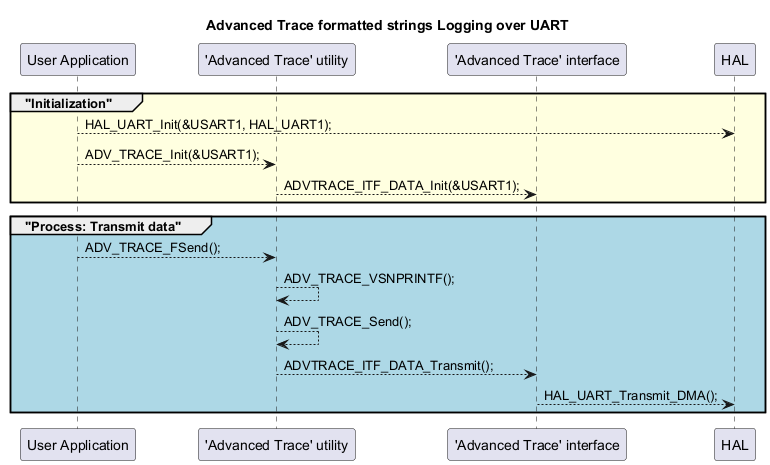
This use case demonstrates how to send formatted strings with Advanced Trace over UART. It requires:
UART interface configured with DMA for TX (baud rate, pins, instance).
Advanced Trace initialized with the selected UART interface.
A UART terminal or viewer connected to the target port.
The code required to implement this use case is as follows:
static uint32_t sent_message_count = 0;
static uint32_t failed_message_count = 0;
if (ADV_TRACE_FSend("Formatted log message: count=%lu\r\n", (unsigned long)sent_message_count) != ADV_TRACE_OK)
{
  /* Simple error handling: count a failed message */
  failed_message_count++;
}
sent_message_count++;
The following diagram illustrates the formatted strings logging over UART sequence:
Conditional Logging Over UART 
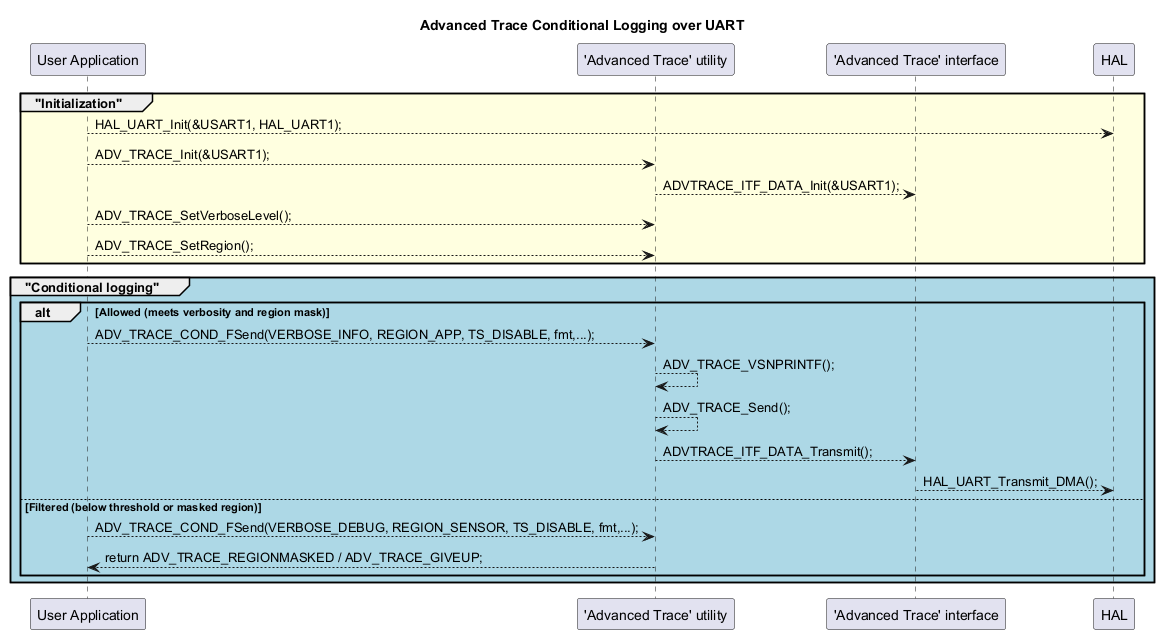
This use case demonstrates how conditional logging selects specific traces based on verbosity levels and region masks to focus on relevant information and manage UART bandwidth. It requires:
UART interface configured with DMA for TX (baud rate, pins, instance).
Advanced Trace initialized with the selected UART interface.
A UART terminal or viewer connected to the target port.
ADV_TRACE_CONDITIONAL enabled.
The code required to implement this use case is as follows:
/* Verbosity levels */
#define VERBOSE_DEBUG  (0U)
#define VERBOSE_INFO   (1U)
#define VERBOSE_WARN   (2U)
#define VERBOSE_ERROR  (3U)

/* Region bitmasks */
#define ADV_TRACE_REGION_NETWORK    (1U << 0)
#define ADV_TRACE_REGION_SENSOR     (1U << 1)

/* Timestamp control */
#define TS_DISABLE     (0U)
#define TS_ENABLE      (1U)

/* Set verbosity threshold (emit INFO and above) and active regions */
ADV_TRACE_SetVerboseLevel(VERBOSE_INFO);
ADV_TRACE_SetRegion(ADV_TRACE_REGION_NETWORK | ADV_TRACE_REGION_SENSOR);

/* Example: emitting a NETWORK trace */
if (ADV_TRACE_COND_FSend(VERBOSE_INFO, ADV_TRACE_REGION_NETWORK, TS_DISABLE,
                         "NET[INFO]: link up, speed=%u\r\n", 115200U) != ADV_TRACE_OK)
{
  /* Handle ADV_TRACE_MEM_FULL, ADV_TRACE_ERROR, ADV_TRACE_GIVEUP, or ADV_TRACE_REGIONMASKED */
}

/* Example: region-masked SENSOR trace (if only NETWORK is enabled) */
ADV_TRACE_SetRegion(ADV_TRACE_REGION_NETWORK);
adv_trace_status st_sensor = ADV_TRACE_COND_FSend(VERBOSE_INFO, ADV_TRACE_REGION_SENSOR, TS_DISABLE,
                                                  "SENSOR[INFO]: new sample=%u\r\n", 42U);
if (st_sensor == ADV_TRACE_REGIONMASKED)
{
  /* Not emitted: SENSOR region is not currently active */
}
The following diagram illustrates the conditional logging over UART sequence:
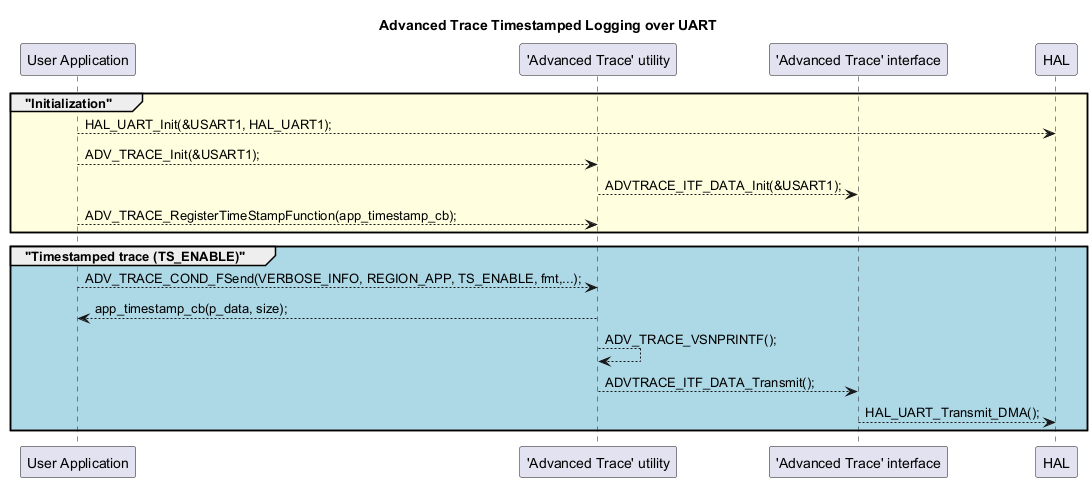
Timestamped Logging Over UART 
This use case demonstrates how to add a timestamp prefix to traces by using a timestamp callback. It requires:
Requirements:
UART interface configured with DMA for TX (baud rate, pins, instance).
Advanced Trace initialized with the selected UART interface.
A UART terminal or viewer connected to the target port.
ADV_TRACE_CONDITIONAL enabled (timestamping is available only through the conditional API ADV_TRACE_COND_FSend; the other APIs remain available but do not support timestamping).
Code to implement the timestamp callback and its registration:
/* Timestamp callback using SysTick (HAL_GetTick returns milliseconds) */
static void app_timestamp_cb(uint8_t *p_data, uint16_t *size)
{
  unsigned long ts_ms = (unsigned long)HAL_GetTick();
  int n = ADV_TRACE_VSNPRINTF((char *)p_data, ADV_TRACE_MAX_TIMESTAMP_SIZE, "[%lu ms] ", ts_ms);
  *size = (n > 0) ? (uint16_t)n : 0U;
}

/* Register timestamp callback */
ADV_TRACE_RegisterTimeStampFunction(app_timestamp_cb);
The following diagram illustrates the timestamped logging sequence:
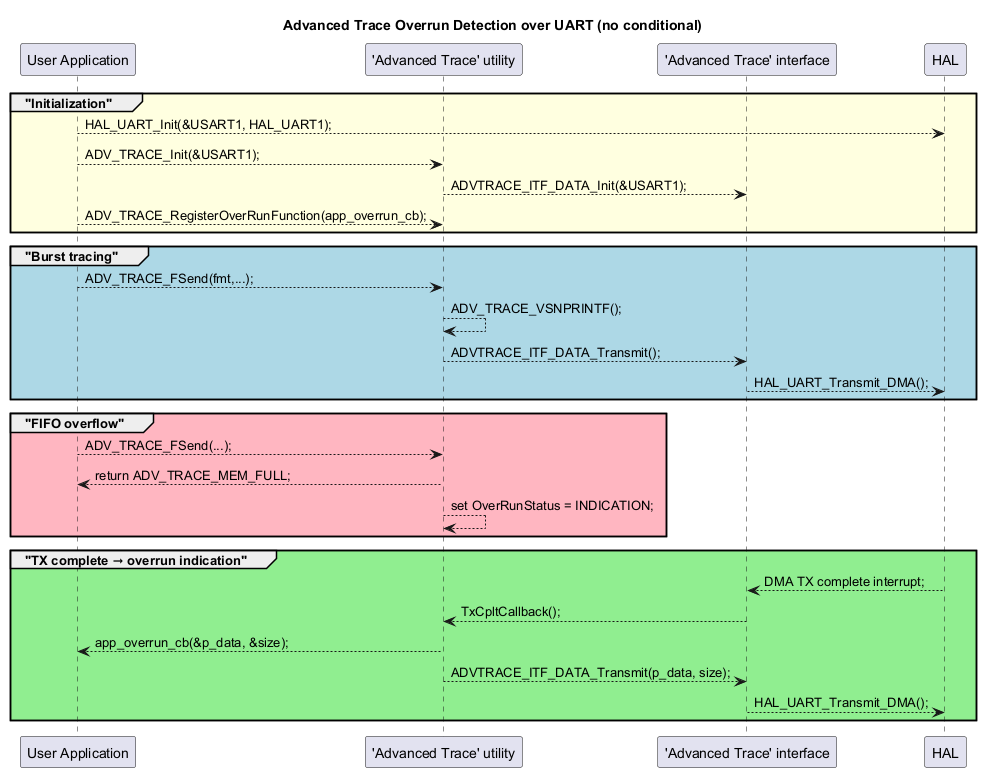
Overrun Detection Over UART 
This use case shows how to detect and handle FIFO overruns by using the overrun callback. It requires:
UART interface configured with DMA for TX (baud rate, pins, instance).
Advanced Trace initialized with the selected UART interface.
A UART terminal or viewer connected to the target port.
ADV_TRACE_OVERRUN enabled.
ADV_TRACE_CONDITIONAL enabled.
The code required to implement this use case is as follows:
/* Overrun indication payload and callback */
static const uint8_t overrun_msg[] = "OVERRUN\r\n";

static void app_overrun_cb(uint8_t **p_data, uint16_t *size)
{
  *p_data = (uint8_t *)overrun_msg;
  *size   = (uint16_t)sizeof(overrun_msg);
}

/* Register the overrun callback at startup */
ADV_TRACE_RegisterOverRunFunction(app_overrun_cb);

/* Normal logging. If the FIFO fills, Advanced Trace schedules one overrun indication */
while (ADV_TRACE_MEM_FULL == ADV_TRACE_COND_FSend(0U, 0U, 0U, "Burst %u\r\n", 0U))
{
  /* app_overrun_cb is invoked */
}
The following diagram illustrates the overrun detection sequence:
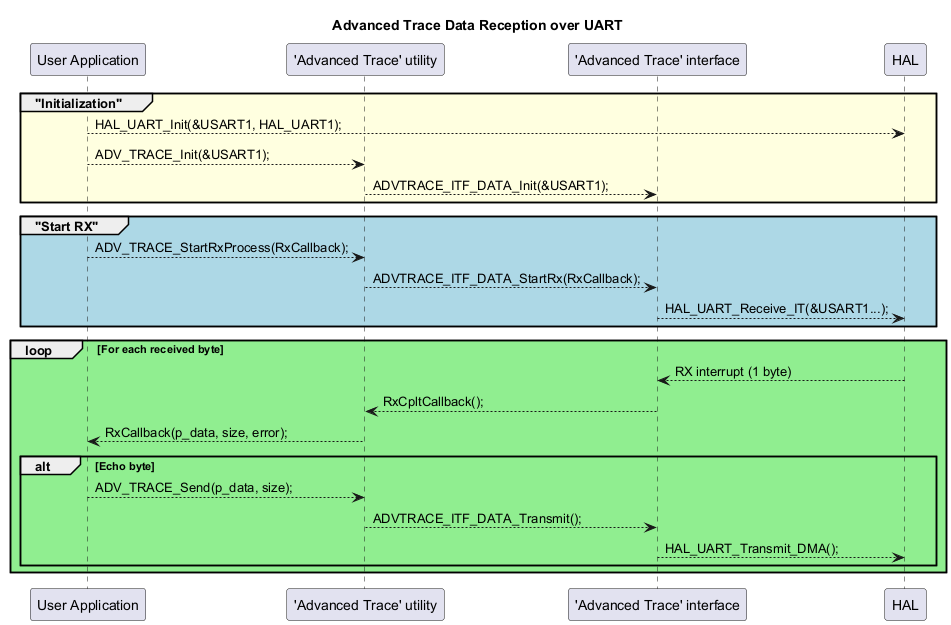
Data Reception Over UART 
This use case demonstrates how to receive data over UART by using Advanced Trace.
Note
The current implementation of the UART data interface only supports receiving data one byte at a time (unitary reception).
The code below implements an echo of the received data: each received byte is sent back as is over UART.
It requires:
UART interface configured with TX and RX (baud rate, pins, instance).
Advanced Trace initialized with the selected UART interface.
An external device that sends data to the target UART RX pin.
Required code to implement this use case is as follows:
uint8_t rx_buffer[64];
uint16_t received_size = 0U;
uint16_t buffer_size = 0U;

  /* Reception callback */
  static void RxCallback(uint8_t *p_data, uint16_t size_byte, uint8_t error)
  {
    if (p_data != NULL && error == 0U && size_byte > 0U)
    {

    /* Compute the buffer capacity */
    buffer_size = (uint16_t)sizeof(rx_buffer);

    /* Copy the received data into rx_buffer without exceeding its size */
    for (uint16_t i = 0U; (i < size_byte) && (received_size < buffer_size); i++)
    {
      rx_buffer[received_size++] = p_data[i];
    }

    /* Echo all collected data so far (raw bytes) */
    (void)ADV_TRACE_Send(rx_buffer, received_size);

    /* If the buffer is full, reset it to start over */
    if (received_size >= buffer_size)
    {
      received_size = 0U;
    }
    }
    else
    {
      /* Handle the reception error */
    }
  }

 /* Start reception */
 if (ADV_TRACE_StartRxProcess(RxCallback) != ADV_TRACE_OK)
 {
   /* Handle the start error */
 }
The following diagram illustrates the data reception over UART sequence:
List of Advanced Trace examples 
The following table lists the available examples:
|
Example Name |
Description |
|---|---|
|
Send and receive data over UART. |