
Build 
Build System Overview 
The build system in STM32CubeIDE integrated with VS Code is designed to efficiently compile and link your STM32 embedded projects. It leverages the GNU Arm Embedded Toolchain and Makefiles to automate the build process.
Key components of the build system include:
-
Compiler: Converts source code files (.c, .cpp) into object files (.o).
-
Linker: Combines object files and libraries into the final executable binary.
-
Makefiles: Define the build rules, dependencies, and commands for incremental or full builds.
-
Build Targets: Different configurations such as Debug and Release, controlling optimization and debug information.
The integration with VS Code allows you to invoke builds directly from the editor interface, view build progress, and inspect output logs for diagnostics.
Incremental vs Full Builds 
The build process generates several output files and artifacts essential for debugging, flashing, and deployment:
-
Object Files (.o): Intermediate compiled files for each source file.
-
Executable Binary (.elf): The main output containing machine code, debug symbols, and metadata.
-
Hex and Binary Files (.hex, .bin): Formats suitable for programming the microcontroller’s flash memory.
-
Map File (.map): Provides detailed memory layout and symbol information for analysis.
-
Build Logs: Console output capturing compiler and linker messages, warnings, and errors.
By default, these artifacts are located in the project’s Debug or Release directories, depending on the selected build configuration. You can customize output paths and file naming conventions through project settings in STM32CubeIDE and VS Code.
Build Output and Artifacts 
The build process generates several output files and artifacts essential for debugging, flashing, and deployment:
-
Object Files (.o): Intermediate compiled files for each source file.
-
Executable Binary (.elf): The main output containing machine code, debug symbols, and metadata.
-
Hex and Binary Files (.hex, .bin): Formats suitable for programming the microcontroller’s flash memory.
-
Map File (.map): Provides detailed memory layout and symbol information for analysis.
-
Build Logs: Console output capturing compiler and linker messages, warnings, and errors.
By default, these artifacts are located in the project’s Debug or Release directories, depending on the selected build configuration. You can customize output paths and file naming conventions through project settings in STM32CubeIDE and VS Code.
Customizing Build Process 
STM32CubeIDE integrated with VS Code offers flexible options to customize the build process to fit specific project requirements. Customization can be achieved by modifying Makefiles, adjusting project properties, or adding scripts.
Common customization tasks include:
-
Changing compiler and linker options
-
Defining preprocessor macros
-
Specifying additional include or library paths
-
Adding custom build steps or post-build actions
-
Selecting different build configurations (Debug, Release)
Customizing the build process allows you to optimize performance, enable debugging features, or integrate third-party tools seamlessly.
Adding Custom Build Steps 
Custom build steps enable you to execute additional commands during the build process, such as code generation, file copying, or running tests. In VS Code, custom build steps are managed through editable configuration files rather than a graphical interface. This approach provides flexibility to tailor the build process precisely to your needs.
Managing Custom Build Steps via JSON Configuration Files
The primary files involved in customizing build steps for STM32CubeIDE projects in VS Code are located in the .vscode folder:
-
tasks.jsonDefines build tasks and commands that can be executed independently or as part of a build sequence. Custom build steps such as code generation, file copying, or running scripts can be added here. -
c_cpp_properties.jsonConfigures include paths, preprocessor definitions, and compiler settings to ensure IntelliSense and build consistency.
Adding Custom Build Steps in
tasks.json
To add a custom build step, you define a new task in
tasks.json. Tasks can be chained using the
dependsOn
attribute, allowing you to run custom commands before or after the main build.
Example : Adding a Post-Build Script
{
"version": "2.0.0",
"tasks": [
    {
    "label": "Build Project",
    "type": "shell",
    "command": "make all",
    "group": "build",
    "problemMatcher": ["$gcc"]
    },
    {
    "label": "Post Build Step",
    "type": "shell",
    "command": "python scripts/post_build.py",
    "dependsOn": "Build Project",
    "problemMatcher": []
    }
]
}
Build Flags and Optimization Settings 
Build flags control how the compiler and linker process your source code, impacting performance, size, and debugging capabilities. STM32CubeIDE supports a wide range of flags accessible via project settings.
Common categories of build flags:
-
Optimization Flags: Control code optimization level, e.g., -O0 (no optimization) to -O3 (maximum optimization).
-
Debugging Flags: Enable generation of debug symbols with -g .
-
Warning Flags: Enable or disable compiler warnings, e.g., -Wall to enable all warnings.
-
Preprocessor Flags: Define macros with -D to conditionally compile code.
-
Linker Flags: Control linking behavior, such as specifying libraries or memory layout.
Adjusting these flags can help balance between code size, execution speed, and ease of debugging.
Troubleshooting Build Errors 
Build errors can arise from various sources such as syntax mistakes, missing files, or configuration issues. Effective troubleshooting involves systematic analysis and correction.
Steps to troubleshoot build errors:
-
Read the error messages carefully: They often indicate the file and line number causing the issue.
-
Check include paths and dependencies: Missing headers or libraries are common causes.
-
Verify compiler and linker flags: Incorrect flags can cause build failures.
-
Clean and rebuild the project: Sometimes stale object files cause conflicts.
-
Consult documentation and forums: STM32CubeIDE and GCC communities provide valuable insights.
Common Build Issues and Fixes 
Here are some frequent build issues and recommended solutions:
-
Missing Header Files: Ensure include paths are correctly set in project properties.
-
Undefined References: Verify that all required libraries are linked and source files are included.
-
Syntax Errors: Review code for typos, missing semicolons, or mismatched braces.
-
Memory Overflow: Check linker script and optimize code size or increase memory allocation.
-
Permission Denied Errors: Confirm file system permissions and that no other process locks build files.
Using Build Logs for Debugging 
Build logs provide detailed output from the compiler and linker, essential for diagnosing build problems.
Tips for using build logs effectively:
-
Enable verbose build output to see all commands executed.
-
Search logs for keywords like “error”, “warning”, or “undefined”.
-
Compare logs between successful and failed builds to identify differences.
-
Use log timestamps to correlate build steps with errors.
-
Save logs for sharing with colleagues or support teams.
In VS Code, build logs are accessible in the terminal or output panels, allowing easy navigation and filtering.
Build button 
-
What Does the Build Button Build? :
The Build button in the CMake View triggers the build process for the currently selected target. This target is specified in the CMake configuration and can be an executable, library, or other build artifacts. The build button ensures that the selected target is compiled and linked according to the defined build configuration.
-
Building the Correct Context in Multi-Project Workspaces :
In case of multiple projects within a workspace, the CMake View allows you to select the correct project context for building and exploring files. You can switch between different CMake projects by selecting the desired project in the CMake View. This ensures that the build commands and file explorations are executed within the correct project context, providing a seamless development experience across multiple projects.
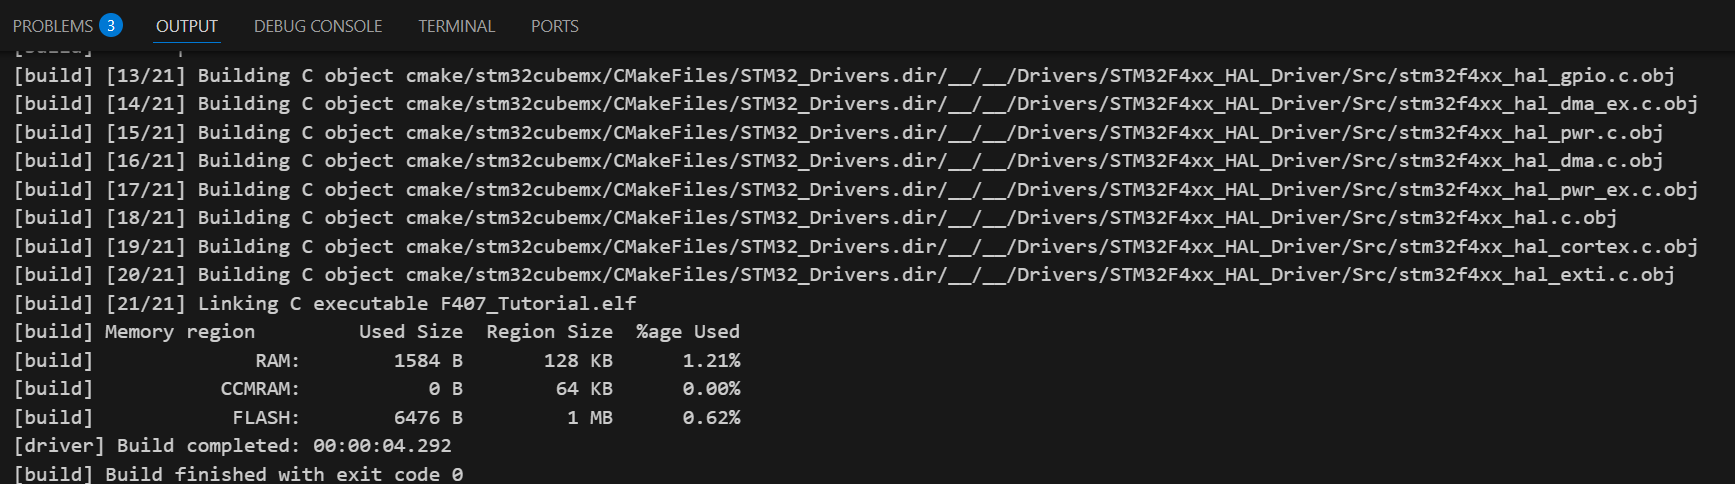
After building the project, the output log should look similar to this:
-
- Switching Between Debug and Release Configurations :
-
To switch between Debug and Release configurations, follow these steps:
-
Open the Command Palette : Press
Ctrl


                  +


                  Shift


                  +


                  P
to open the Command Palette. -
Select a CMake Configuration : Type and select
CMake:


                  Select


                  Configure


                  Preset
. -
Choose a Preset : In the list of available presets, choose the appropriate configuration (e.g.,
DebugorRelease). This will reconfigure your project to use the selected build type.
Alternatively, you can switch configurations directly from the CMake View:
-
Open the CMake View : Click on the CMake icon in the Activity Bar on the side of the window.
-
Select a Configuration : Use the dropdown menu to select the desired configuration (e.g.,
DebugorRelease).
-