
Debug 
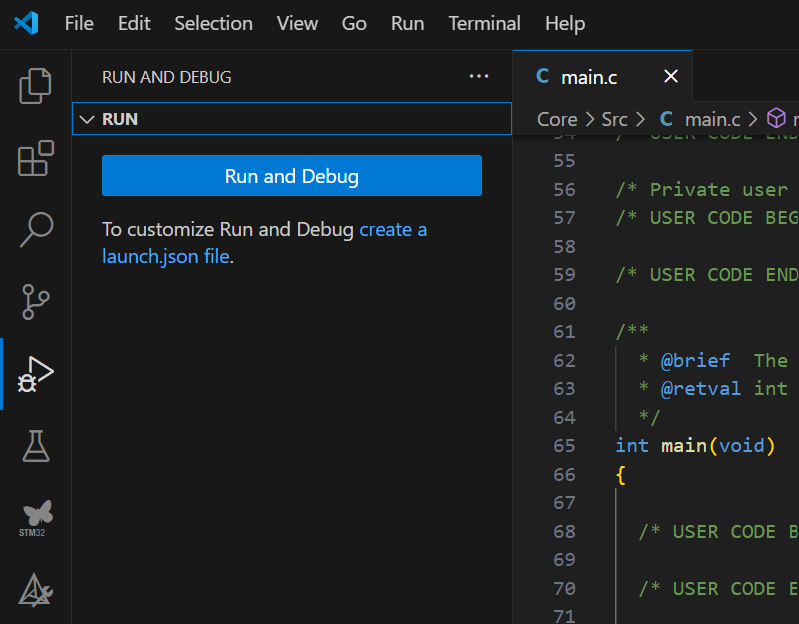
After the first successful build, you can start a debug session. In the Run and Debug section (Ctrl+Shift+D) , click the blue Run and Debug button to begin the debug session.
Note
Common issues at first launch
One of the most common problems when starting a new debug session is that the debugger firmware might need to be updated.
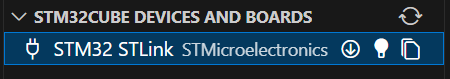
If you use ST-LINK, you can see the debug device under the STM32CUBE DEVICES AND BOARDS section. Click the arrow pointing down to update the firmware.
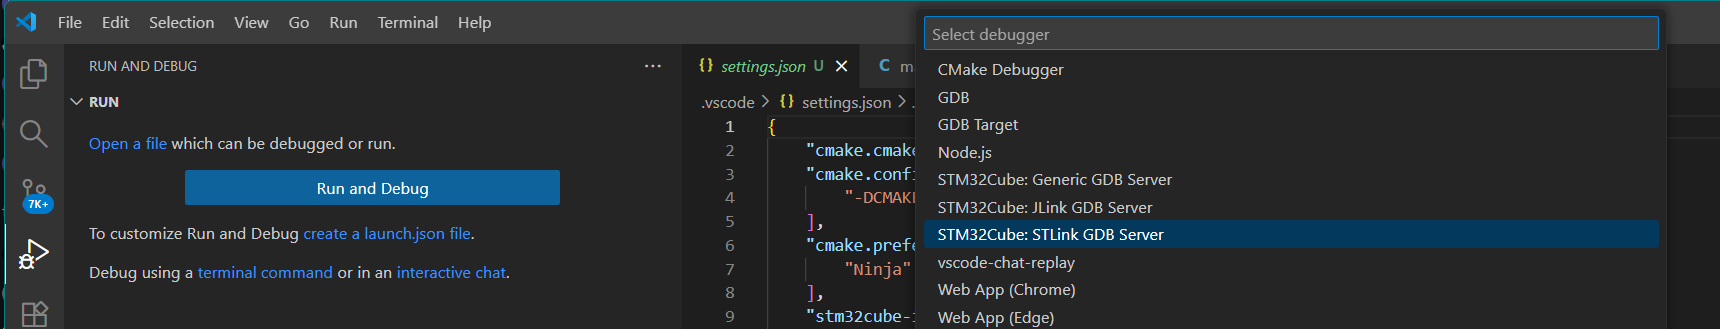
VS Code may ask which debug probe you use in a drop-down menu. Select the device to set this up correctly.
If VS Code is unsure about what to debug, it is likely that there is no previously successful build and no
.elf
file has been generated.
To resolve this, troubleshoot the build process.
When the debug session begins, you have access to all the debugging features of VS Code. Additional debugging features, such as those from STM32CubeIDE, are planned for future releases.
For more information about debugging inside VS Code, see Visual Studio Code debugging documentation .
Third-party debug extensions 
ST provides a debug solution for the STM32 extension in Visual Studio Code. Developers can use third-party extensions for debugging if preferred.
Developers using Cube 2.0 extensions often use the Marus25 cortex-debug extension. To ensure a smooth transition, you can continue using it. However, we recommend our solution as the primary method for debugging STM32 projects.
For more information on the Marus25 cortex-debug extension, see:
Debug features 
Below are some important debug features.
Breakpoints
Breakpoints pause program execution at specific lines of code. This helps examine the application state at critical points. You can set, remove, and manage breakpoints in the VS Code editor.
For more details, see VS Code Breakpoints Documentation .
Setting breakpoints in assembly files
-
Open Settings (Ctrl + ,)
-
Click the gear icon in the bottom-left corner of the VS Code window.
-
Select Settings from the dropdown menu.
-
-
Search for the Setting
-
In the search bar at the top of the Settings panel, search for Allow Breakpoints.
-
-
Enable the Setting
-
Locate Allow Breakpoints in any file in the search results.
-
Check the box next to it.
-
-
Verify the Change
-
Close the Settings panel and test by adding breakpoints in non-standard locations to ensure the setting is active.
-
CPU Registers
The CPU Registers view displays the current values in the CPU registers. This is essential for low-level debugging and understanding the processor state.
Local/Global Variables
The Variables view shows the current values of local and global variables in your application. This helps track the program state and understand how data is manipulated.
Peripheral View
The Peripheral view allows you to inspect and interact STM32 microcontroller peripherals. This includes viewing and modifying the state of registers associated with peripherals.
Memory View
The Memory view displays memory regions in your application. You can inspect and modify memory contents, which is useful for debugging memory-related issues.
Disassembly View
The Disassembly view shows the assembly code corresponding to the high-level source code. This is useful for low-level debugging and understanding how the compiler translates your code.
RTOS Views
The RTOS views provide insights into the state of the real-time operating system in your application. This includes information about tasks, queues, and other RTOS objects.
Fault Analyzer
The Fault Analyzer helps diagnose and understand the causes of faults in your application. It provides detailed information about the fault, including the type and location.
Board Manager
The Board Manager allows you to manage and configure STM32 development boards connected to your system. This includes selecting the target board and configuring debug settings.
Debug launch 
To start a debug session, configure a debug launch configuration. Specify the target, debug settings, and other options in the
launch.json
file.
Initially, your project might not include a
launch.json
file. In the Run and Debug
(Ctrl+Shift+D)
menu in the Activity Bar, click the Run and Debug button to specify a target.
After selecting a target, an
on the fly
default
launch.json
file is created and used for the debug session:
"initialConfigurations": [
  {
    "type": "stlinkgdbtarget",
    "request": "launch",
    "name": "STM32Cube: STM32 Launch ST-Link GDB Server",
    "origin": "snippet",
    "cwd": "${workspaceFolder}",
    "preBuild": "${command:st-stm32-ide-debug-launch.build}",
    "runEntry": "main",
    "imagesAndSymbols": [
      {
        "imageFileName": "${command:st-stm32-ide-debug-launch.get-projects-binary-from-context1}"
      }
    ]
  }
],
Caution
When using this method, the
launch.json
file is created temporarily and is not be saved after the debug session closes.
For more information on configuring and starting a debug session, see the VS Code Debugging Documentation .
By using these debug features, you can develop, test, and optimize your STM32 applications in Visual Studio Code.
Configuring debug sessions with
launch.json
Debug configurations in STM32CubeIDE for Visual Studio Code are managed through the
launch.json
file in the
.vscode
folder of your project workspace. This JSON file defines how the debugger connects to the target and controls the debug session.
To create an editable
launch.json
file, go to
“Run and Debug”
(Ctrl+Shift+D)
and click the
create a launch.json file
hyperlink.
Caution
The .vscode folder containing the
launch.json
file must be in the root of the project.
Tip
To quickly open the
launch.json
file, click the cogwheel next to the drop-down menu.
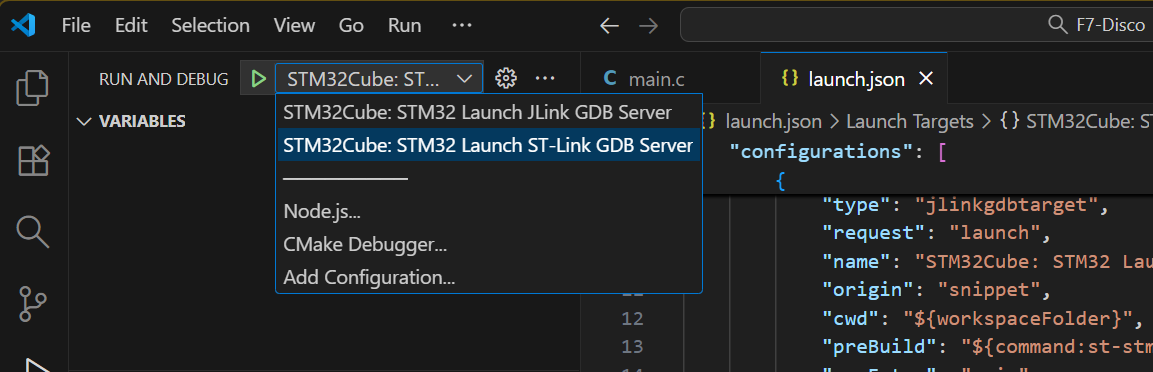
Multiple targets can be set up in the same
launch.json
file. To select a configuration, choose the desired option in the drop-down menu next to the green arrow used to launch a debug session.
Key attributes of
launch.json
By default these attributes will be set up when first creating a
launch.json
file.
type: Specifies the debugger type, for example, stlinkgdbtarget or jlinkgdbtarget .
request: Defines the type of request. Common values are “launch” to start a new debug session or “attach” to connect to a running target.
name: A descriptive name for the debug configuration. This appears in the Visual Studio Code debug drop-down menu.
origin: Origin of the debug configuration, for example, “snippet” for configuration snippets.
cwd: Working directory to use when launching GDB.
preBuild: Uses the default command to build the project before starting the debug session.
runEntry: If defined, the debugger runs until the start of the specified function. You can also specify a line of code, for example:
runEntry: "main.c:203"
imagesAndSymbols: List of image and symbol files to load at the given (optional) offset.
Caution
If the serverPort attribute is defined, two ports are used by the ST-LINK GDB server: one for the debug session and serverPort + 1 for the SWO connection.
These ports are reserved even if SWO is not activated in the debug configuration.
If you plan to having multiple debugging sessions, set additional serverPort values at least two apart.
For more information on debug configuration , see the VS Code Debug Configuration Documentation .
Additional attributes of
launch.json
In the
launch.json
file, use the auto-complete feature
(Ctrl+Space)
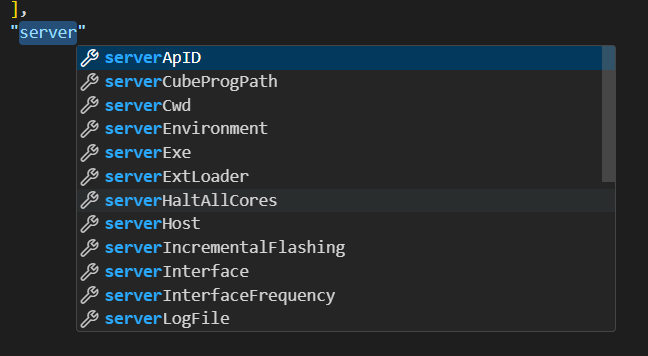
, to display a list of all attributes.
Hover over a specific attribute to view its description and additional information.
For example, by typing server and using the auto-complete feature (Ctrl+Space) , a list of all attributes containing the word server is shown:
External loader 
To configure an external loader, you must first have a
launch.json
file for your project.
To create this file, refer to the
Configuring debug sessions with launch.json
guide.
Set up the external loader using the serverExtLoader attribute. The required parameters for this attribute are:
-
loader: Path to the external loader.
-
initialize: Boolean value to initialize the external memory. Set to true or false .
Live watch 
To configure the Live Watch feature, you must first have a
launch.json
file for your project.
To create this file, refer to the
Configuring debug sessions with launch.json
guide.
Set up the Live Watch feature using the liveWatch attribute. The required parameters for this attribute are:
-
enabled: Boolean value. Set to true or false .
-
samplesPerSecond: Number of samples per second. The default value is 4.
Debugging a running target 
To attach to a running target, you must first have a
launch.json
file for your project.
To create this file, refer to the
Configuring debug sessions with launch.json
guide.
Configure the
launch.json
with the following attributes to debug an already running target:
-
imagesAndSymbols: Set to loadSymbol .
-
serverReset: Set to none .
-
runEntry: Delete this attribute.
RTOS 
To use RTOS with the debug session, you must first have a
launch.json
file for your project.
To create this file, refer to the
Configuring debug sessions with launch.json
guide.
Set up the RTOS feature using the serverRtos attribute. The required parameters for this attribute are:
-
enabled: Boolean value. Set to true or false to enable or disable RTOS support.
-
port: TCP port on which RTOS data is served to the STM32Cube RTOS view. The default value is 60000.
-
driver: RTOS type used by the project, for example, freertos or threadx .
-
driverPort: Port for the selected driver. This parameter is optional; it is set automatically.
-
proxyPath: Path to the binary proxy server. This parameter is optional; it is set automatically.
RTOS views 
When RTOS is enabled, the STM32Cube RTOS view is available in the VS Code panel, alongside the Problems, Output, Terminal, and Debug Console tabs.
This view displays RTOS-related data for the active debug session.
Tip
Click Open in editor to show the RTOS data in the main editor area. You can also right-click the editor tab and select to open it in a new window, for example, to place the RTOS view on a second monitor.