
 general

How to validate a neural network on STM32N6 
This tutorial explains how to establish a strong validation strategy for a neural network
deployed on STM32N6
with the Neural-ART NPU, using STM32Cube AI Studio or the
ST Edge AI Core CLI (via the
ai_runner
Python script) when the GUI is not enough.
Objective 
Verify that a neural network deployed on STM32N6 preserves numerical accuracy, fits within the memory budget (internal + external), actually uses the NPU for most of its compute, and meets real-time constraints.
Validation pipeline 
Prerequisite - Upstream quantization (strongly recommended): the Neural-ART NPU executes int8 operations. Partially quantized models are accepted: int8 layers run on the NPU, remaining float layers fall back to the Cortex-M55 as SW or hybrid epochs. For useful NPU speedup, quantize as much of the model as possible and validate the quantized model in your training framework before importing into Studio.
Step 1 - Analyze on host: does the model fit, are all its ops mapped on the NPU (or how many fall back to CPU), and does the memory-pool placement look sane?
Step 2 - Validate on target: does it hold on the real STM32N6, with real numerical correctness, real inference time, and expected NPU utilization?
Step 3 - End-to-end application validation: does the full pipeline (preprocess + inference + postprocess) meet your production metric on real data?
Note
Unlike the STM32 CPU flow,
--mode


             host
(running the compiled model on the PC) is
not part of the NPU workflow: the Neural-ART compiler emits code that only executes on the
NPU hardware. Numerical validation therefore happens on the board.
Prerequisites 
Tools 
|
Tool |
Purpose |
|---|---|
|
Primary GUI - handles STM32N6 target and NPU_Validation firmware |
|
|
CLI engine (includes the Neural-ART compiler) |
|
|
Project generation |
|
|
Board flashing (external Flash included) |
|
|
Toolchain (or IAR / Keil) |
Board 
Any STM32N6-based board with the Neural-ART NPU, for example:
STM32N6570-DK (Discovery Kit)
NUCLEO-N657X0-Q
Both are supported by the pre-integrated Studio validation flow.
Studio project setup 
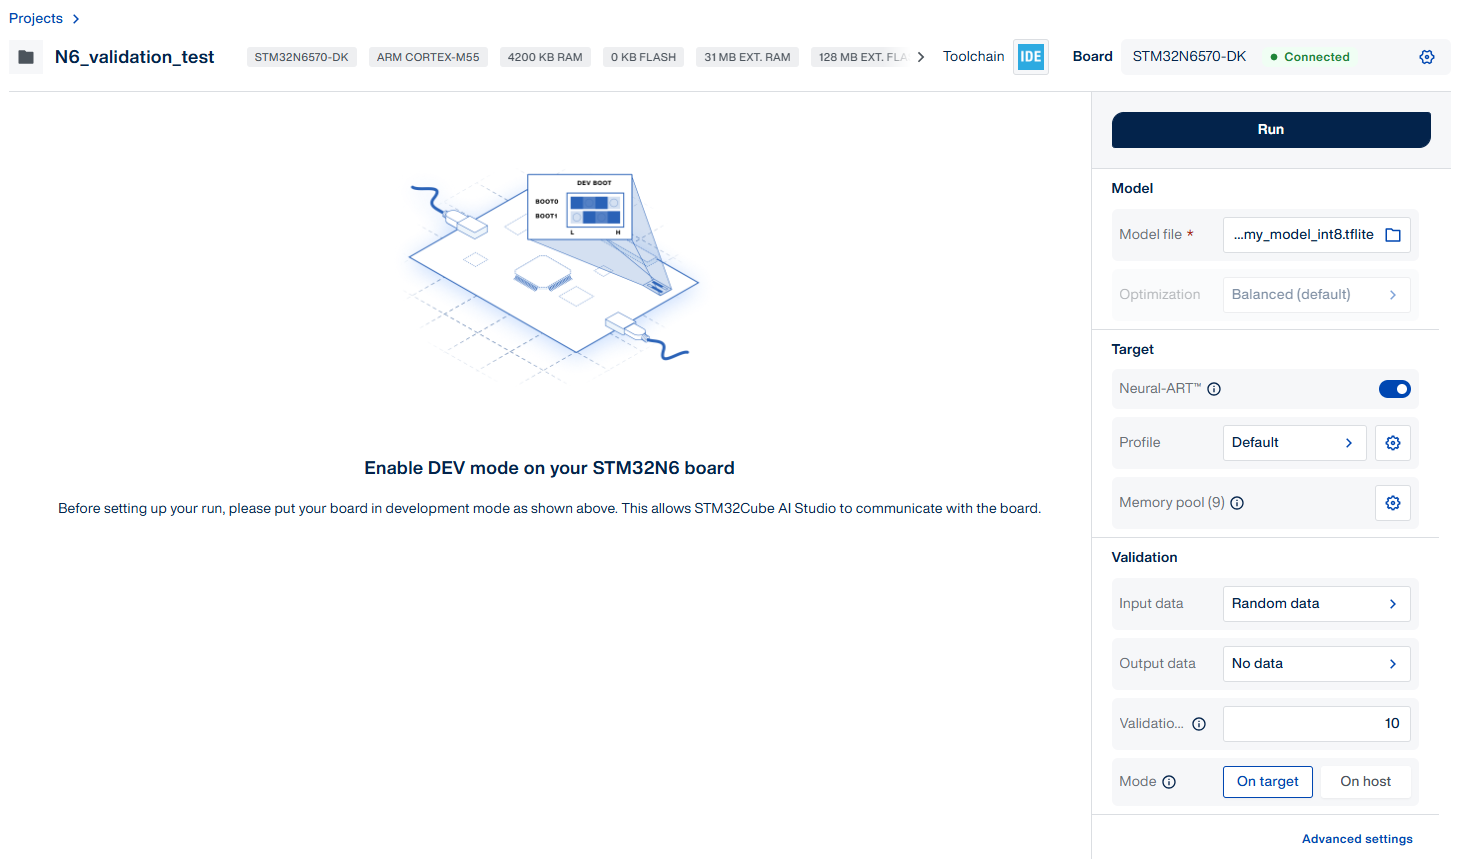
Launch STM32Cube AI Studio.
Project: name + workspace path.
Select Target: an STM32N6 board or MCU part.
Select Toolchain.
Import your quantized int8 model (TFLite or ONNX QDQ).
Validate your quantization first 
Warning
Studio cannot detect a bad quantization. When feeding a quantized model to Studio, the
reference used by
validate
is the
already-quantized
.tflite
/
.onnx
file - not
the original float model. A bad quantization therefore compares a degraded reference against
an equally degraded C-model: COS, L2r and ACC still look fine while accuracy vs the float
model is already lost. This step must be done before importing into Studio.
So:
Quantize in your training framework (int8 activations + int8 weights).
Measure accuracy there, on your validation set, with your production metric.
Confirm accuracy is acceptable before importing into Studio.
If Studio’s on-target validation later disagrees with that upstream accuracy, the divergence is in the conversion or compilation stage.
Validation data 
Without a custom dataset, Studio’s Run (and
stedgeai


             validate
without
-vi) uses
random inputs matched to the model’s input dtype (see
Random data generation):
int8inputs: uniform in[-128, 127].uint8inputs: uniform in[0, 255].
Random is a valid first pass. It catches crashes, unsupported ops, CPU fallback surprises, and shape mismatches without any data plumbing.
Always prefer a representative dataset.
Reference example 
The commands and snippets throughout this tutorial use generic placeholders
(
<model>_int8.tflite,
<validation_dataset>.npz). Substitute your own files.
If you need a ready-made quantized model to try the flow, the
STM32 Model Zoo
ships several
N6-ready int8 entries (image classification, object detection, human activity recognition,
etc.). You will need to prepare your own validation dataset
.npz
with the keys
stedgeai


            validate
and Studio expect:
m_inputs_1-> input batch, shape(N, ...input_shape), dtype matching the model input.m_outputs_1-> one-hot reference labels, so ACC is meaningful.
Step 1 - Analyze on host (feasibility + NPU coverage) 
Before touching the board, run Analyze to answer three questions in seconds:
Fit: does the model fit in the target’s memory (internal + external, per the memory pool)?
NPU coverage: which ops are mapped on the NPU HW and which fall back to CPU software?
Memory-pool placement: are weights and activations placed in fast internal RAM or spilled to external Flash / PSRAM?
Warning
NPU coverage is critical. Every op that falls back to CPU runs one to two orders of magnitude slower than on the NPU. Reference: NPU operator support.
In STM32Cube AI Studio, Analyze is performed via the Run command:
Set Mode to On desktop.
Click Run.
Studio runs the Neural-ART compiler and displays operator coverage (HW vs SW/HYBRID), memory footprint per pool, and any warnings about unsupported ops.
Tip
Equivalent CLI:
stedgeai


             analyze


             -m


             <model>.onnx


             --target


             stm32n6


             --st-neural-art
.
The
--st-neural-art
flag targets the Neural-ART NPU. See the
CLI reference
and the
memory initializers guide.
Only proceed to Step 2 once the coverage and footprint look right.
Step 2 - Validate on target (on-device validation) 
Run the compiled model on the real STM32N6. Checks numerical correctness and measures actual NPU performance.
What it reveals 
Numerical correctness of the deployed model (COS, L2r, ACC vs source-framework reference).
Real inference time on the NPU + MCU.
Per-epoch performance breakdown (NPU cycles, MCU cycles, ops/cycle, cache counters).
External-memory access volume and bandwidth.
HW/SW workload split.
In Studio 
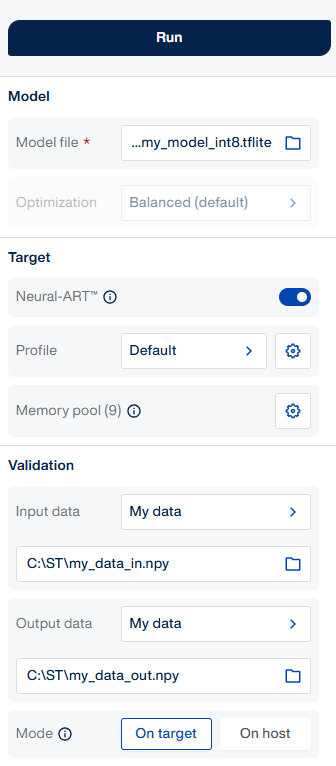
Validation section of the Run dialog:
Mode: On target.
Connect the board over USB.
Validation data: pick Custom dataset.
Click Run.
Studio generates the NPU code, programs weights to the on-board external Flash if needed, flashes the pre-integrated NPU_Validation firmware, runs validation, and collects results. All steps happen automatically.
Note
The NPU_Validation firmware runs with CM55 caches enabled by default
(
USE_MCU_DCACHE
/
USE_MCU_ICACHE). Higher-performance options
(overdrive) are exposed as build-time switches in
Core/Inc/app_config.h. See the
NPU Validation project reference.
Tip
Equivalent CLI chain, replicating what Studio does automatically:
Generate the NPU code and the weights binary:
stedgeai generate --target stm32n6 -m <model>.onnx --st-neural-artThis produces
network.c/.h,network_ecblobs.h, and the weights binarynetwork_atonbuf.xSPI2.rawin the output directory.Deploy to the board with n6_loader, the helper script that copies the generated files into the
NPU_Validationproject, builds it, flashes the firmware, and programs the weights to external xSPI Flash. It is driven by two JSON config files:$STEDGEAI_CORE_DIR/scripts/N6_scripts/config.json: external tools (compiler_typegcc/iar,gdb_server_path, STM32CubeIDE / STM32CubeProgrammer paths).config_n6l.json:network.cpath,project_path(NPU_Validation project),project_build_conf(N6-DK,N6-DK-USB,N6-Nucleo,N6-Nucleo-USB).
Edit both files once, then run:
python $STEDGEAI_CORE_DIR/scripts/N6_scripts/n6_loader.py \
    --n6-loader-config ./config_n6l.json
See the n6_loader configurations section for the full field reference.
Note
n6_loader loads the firmware image through a debug session, so the board must be set to development boot mode (boot switches in dev position), not the standalone boot-from-flash mode used to run a deployed application.
Validate on the flashed board:
stedgeai validate --target stm32n6 --mode target --st-neural-art \
    -vi <validation_dataset>.npz -d serial:<port>:921600
Use real data 
Real, representative data is the only thing that produces meaningful accuracy numbers, especially for quantized models.
Same preprocessing as training.
One-hot reference outputs for classifiers.
Mismatches here cause most “unexpected metric” reports.
What ACC actually measures 
The “reference” ACC compares against depends on whether you provided ground-truth outputs
(
m_outputs_1
in your
.npz):
Without reference outputs, ACC is the agreement between the C-model and the original
framework model (
X-cross
line in the report). This is a conversion fidelity metric, not
a model accuracy metric. A broken model with 10% real accuracy will still report ACC = 100%
here as long as the C-model matches the original.
With reference outputs, the report shows both:
x86


              c-model
and
original


              model
lines
give accuracy against your ground truth (real accuracy), and
X-cross
gives C-model vs
original (fidelity).
Only the ground-truth comparison measures real accuracy. If you skip
m_outputs_1, you are
checking conversion, not accuracy.
Targets for int8 NPU inference:
COS >= 0.99.
ACC drop within the tolerance set upstream when quantizing.
COS <= 0.95: investigate. Use the deep-dive tools below.
Performance metrics 
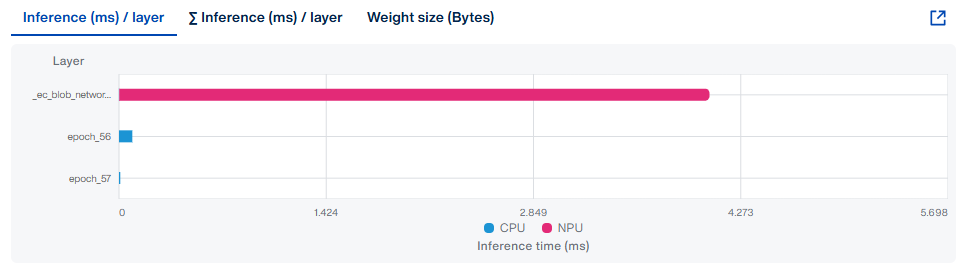
The NPU validation report includes NPU-specific timing and memory data:
|
Metric |
Meaning |
|---|---|
|
Duration |
ms per sample (mean / min / max / std). |
|
NPU cycles |
Cycles executed on the Neural-ART accelerator. |
|
MCU cycles |
Cycles executed on the Cortex-M55 (SW/HYBRID fallback layers). |
|
cycles/MACC |
Efficiency (lower is better). |
|
ops/cycle |
Includes SW epochs (annotated “including SW epochs” in the report). A low value signals CPU fallback dominance. |
|
compute cycles ratio |
Percentage of measured vs ideal NPU cycles. |
|
Memory pools summary |
Bytes and buffers placed per pool (internal / external). |
|
mem accesses per pool |
E.g.
|
|
Pool bandwidth line |
E.g.
|
|
NPU cache counters |
|
|
Used stack / Used heap |
Reported as
|
Going further 
CLI -
stedgeai


              validate


              --mode


              target

Runs against the NPU_Validation firmware Studio already flashed.
# Direct run: import + compile + validate on target
stedgeai validate \
    -m <model>_int8.tflite \
    --target stm32n6 --mode target \
    --st-neural-art \
    -vi <validation_dataset>.npz \
    --batches 200 -d serial:COM6:921600

# Reuse the JSON Studio produced - skips import/compile
stedgeai validate --val-json network_c_info.json --mode target \
    --target stm32n6 -d serial

# Numerical-only pass
stedgeai validate \
    -m <model>_int8.tflite \
    --target stm32n6 --mode target \
    --st-neural-art \
    -d serial --io-only
Note
The
-vi
file must match the model’s expected input dtype (int8 or uint8 depending on how
the model was quantized).
|
When |
Option |
|---|---|
|
Many samples |
|
|
Faster numerical-only pass |
|
|
Skip recompile |
|
|
Pin port / baud |
|
ai_runner
(Python)

stm_ai_runner
(also called
ai_runner) is a Python package shipped with ST Edge AI Core.
It exposes a simple
AiRunner
object that lets you send inputs to the deployed NPU model,
retrieve predictions, and collect NPU profiling information - directly from your own Python
scripts. The same package is what powers
stedgeai


              validate
under the hood, so you can reuse
the NPU_Validation firmware Studio already flashed on the board (over serial).
Use it to extend the fixed CLI workflow with your own dataset loading, metrics, or post-processing:
|
Need |
Why |
|---|---|
|
mAP / IoU / mIoU / WER / top-5 / F1 / PCK |
Not in CLI metric set. |
|
Postprocessing beyond
|
Compare after your postprocessing. |
|
Dataset does not fit a flat file |
Feed your
|
|
Compare vs ground-truth labels or another model |
CLI reference is fixed. |
import numpy as np
from stm_ai_runner import AiRunner

runner = AiRunner()
runner.connect('serial:COM6:921600')
runner.summary()

inputs = my_dataloader.next_batch()
outputs, profiler = runner.invoke(inputs, mode=AiRunner.Mode.PER_LAYER)

score = my_metric(my_postprocess(outputs), ground_truth)
runner.disconnect()
AiRunner.Mode:
IO_ONLY,
PER_LAYER,
PER_LAYER_WITH_DATA,
PERF_ONLY.
Note
PER_LAYER_WITH_DATA
is only available when the runtime exposes
AiRunner.Caps.PER_LAYER_WITH_DATA
for the connected target. On NPU targets this capability
is not guaranteed - check
runner.summary()
first.
See the ai_runner reference for the full API. Step 3 builds on this.
NPU profiler (per-epoch deep-dive) 
On STM32N6 with NPU, the per-layer numerical deep-dive available on Cortex-M targets does not apply. Use the NPU profiler instead.
The NPU profiler reports, per epoch (execution slice), the NPU/MCU cycle split, ops/cycle, cache counters, memory-pool accesses, and bandwidth. It is the reference tool to answer:
“Which epoch is slow?”
“Does that slow epoch run on the NPU or on the MCU?”
“Is it stalled by external memory?”
Enable it by re-running
stedgeai


              validate
with the profiler-oriented options documented in
the
NPU profiler reference. A typical excerpt
looks like:
mcu cycles            : 10919340 (core only = 10515928)
npu cycles            : 13692714 (core only = 13159399)
ops/cycle             : 37.3 GOPS / including SW epochs (core only = 38.8)
compute cycles ratio  : 54.67% (core only: 56.89%)
mem accesses          : [octoFlash: r=1758190, w=0] [npuRAM5: r=19600, w=8820]
octoFlash             : r=1758190    w=0          -> 133.60 MB/s (peak), 128.80 MB/s (average)
NPU cache cnts        : R[hit=0, miss=80, alloc-miss=0, evict=0], W[hit=0, miss=0, ...]
Cross-referencing an epoch back to a specific source-framework layer is model-dependent
(the compiler fuses and reorders ops). Use the analyze report +
runner.summary()
to establish
the mapping for your model.
Bisecting the model with
--cut-*-tensors

For numerical debugging, recompile a sub-graph of the source model and validate it in isolation. Effective for isolating where a divergence between the C-model and the original appears. Particularly useful on large models, to isolate a single layer or a few layers that are suspect.
Pass the tensor name (ONNX) or tensor location (TFLite) to
--cut-input-tensors
and
--cut-output-tensors. Both accept a comma-separated list for multi-input/output sub-graphs.
stedgeai validate \
    -m <model>.onnx \
    --target stm32n6 --st-neural-art \
    --cut-input-tensors <input_tensor_name> \
    --cut-output-tensors <output_tensor_name> \
    --mode target -vi <validation_dataset>.npz -d serial
These options apply at model import, so they work with the NPU flow. Cut around a suspect region, validate the sub-graph, and compare c-model vs original on that region only. Repeat to converge on the diverging tensor.
Reference: –cut-input-tensors.
NPU-specific health checks 
Two failure modes are much more likely on the NPU than on the STM32 CPU flow and deserve an explicit pass after every validate run.
Health check 1 - External-memory
Symptom.
Inference time is much higher than what MACC + NPU frequency predict. Bandwidth to
octoFlash
(or
hexaFlash
/ external PSRAM) is high, NPU cache miss count is non-trivial.
Where to look in the report.
|
Field |
What to check |
|---|---|
|
Memory pools summary |
Weights or large activations placed in an external pool. |
|
mem accesses |
|
|
bandwidth line |
|
|
NPU cache cnts |
|
Mitigation.
Re-tune the memory pool JSON to move hot buffers to a higher-throughput / lower-latency pool. Pool descriptor fields:
throughput,latency,byteWidth. See the memory initializers guide.Add compiler options
--Ocache-optand--cache-maintenance(see the Neural-ART compiler options).Enable
--enable-virtual-mem-poolsfor contiguous placement across pools.Use the
timeoptimization preset when latency is the priority (--optimization 3).
Health check 2 - Low NPU utilization (CPU fallback dominance)
Symptom.
NPU cycles are low, MCU cycles are high,
ops/cycle
is well below the theoretical
maximum, and
compute


              cycles


              ratio
is far from 1.
Where to look in the report.
|
Field |
What to check |
|---|---|
|
Analyze coverage table |
Ops flagged SW or HYBRID instead of HW. |
|
npu cycles vs mcu cycles |
MCU cycles a significant fraction of total. |
|
ops/cycle |
Value well below the NPU’s HW peak (annotated “including SOFTWARE/HYBRID”). |
|
compute cycles ratio |
Ratio much smaller than 1 means real execution is far from ideal. |
Mitigation.
Cross-check each SW/HYBRID op against the NPU operator support page.
Replace unsupported ops (e.g. custom activations, uncommon paddings) with supported equivalents in the source model.
Prune or refactor the layers that dominate
mcu cycles.
Step 3 - End-to-end application validation 
Validate the full pipeline (preprocess + inference + postprocess) on target with real data. Studio
does not automate this step. Use
ai_runner
to drive the NPU_Validation firmware Studio already
flashed in Step 2.
Pattern 
Swap the model call in your training-time eval script for
runner.invoke(...). Keep everything
else.
Example:
import numpy as np
from stm_ai_runner import AiRunner

data = np.load("<validation_dataset>.npz")
x_val = data["m_inputs_1"]                       # (N, ...input_shape), int8 or uint8
y_val = np.argmax(data["m_outputs_1"], axis=-1)  # (N,) class indices

runner = AiRunner()
runner.connect('serial:COM6:921600')

correct = 0
for i in range(len(x_val)):
    raw, _ = runner.invoke(x_val[i:i+1])
    pred = np.argmax(raw, axis=-1)
    correct += int(pred == y_val[i])

acc = correct / len(x_val)
print(f"On-target accuracy: {acc:.4f}")
runner.disconnect()
No firmware rebuild needed:
ai_runner
reuses what Studio flashed in Step 2.
What to validate 
Preprocessing matches training pipeline.
Inference correct on real sensor data.
Postprocessing correct (argmax, NMS, thresholding).
End-to-end timing meets the constraints.
Edge cases: boundary, noisy, adversarial inputs.
Summary 
Validating a neural network on STM32N6 is a three-step funnel where each step catches a different class of defects. The NPU-specific concerns (int8 quantization, NPU coverage, external memory) are handled inside these steps rather than as extra phases.
|
Step |
What it checks |
Tool |
Typical failures caught |
|---|---|---|---|
|
1. Analyze on host |
Feasibility (fits, memory pool) + NPU coverage (HW vs SW/HYBRID) |
Studio Run / On desktop or
|
Unsupported op, model too big for the memory pool, heavy CPU fallback |
|
2. Validate on target |
Numerical behaviour + real NPU/MCU cycles + external-memory pressure |
Studio Run / On device or
|
Compiler/quantization bug, external-memory bottleneck, low NPU utilization |
|
3. End-to-end application validation |
Full pipeline (preprocess + inference + postprocess) against your production metric |
|
Preprocessing mismatch, postprocessing bug, metric regression on real data |
Next steps 
Retune the memory pool and re-run Step 2 if external-memory bandwidth or CPU fallback dominate.
Explore NPU weights encryption for production.
Explore NPU relocatable mode if you need to update the model in the field without re-flashing the firmware.
Integrate the validated model into your application firmware.
Troubleshooting 
Model does not fit / unsupported op - Studio Run reports this immediately; review the import log and coverage table, and adjust the model or the memory pool. See the NPU operator support.
Timeout (50000 ms) during validation - the inference started but never returned. Double-check the ST-Link connection, the board’s boot mode, and the external Flash programming. See the NPU getting-started troubleshooting.
Further reading 
How to Validate a Neural Network on STM32 - the STM32 CPU version of this tutorial.