
 STM32CubeProgrammer

Hard Fault analyzer 
Description 
The STM32CubeProgrammer Fault analyzer feature interprets information extracted from the Cortex-M based device to identify the reasons that caused a fault.
This information is visualized in the Fault analyzer window in GUI mode or in CLI mode. It helps to identify system faults occurring when the CPU is driven into a fault condition by the application software.
Possible detected fault exceptions:
- Hard Fault: default exception, can be triggered by an error during exception
processing by Bus Fault, Memory Management Fault, or Usage Fault if their handler cannot be executed.
- Memory Management Fault: detects memory access violations to regions defined
in the memory management unit, MPU, such as code execution from a memory region with read/write access only.
- Bus Fault: detects memory access errors on instruction fetch, data
read/write, interrupt vector fetch, and register stacking, save/restore, on interrupt entry or exit.
- Usage Fault: detects execution of undefined instructions, unaligned memory
access for load/store multiple. When enabled, divide-by-zero and other unaligned memory accesses are detected.
- Secure Fault: provides information about security related faults for
Cortex-M33 based devices.
Note
Fault analyzer is available only for ST-LINK interfaces.
As shown in the following figure, the Fault Analyzer window has five main sections.
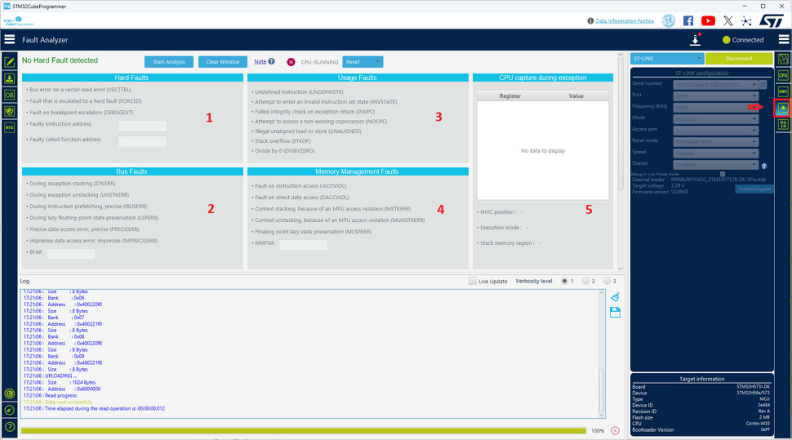
Fig. 55 Fault Analyzer window 
- Hard Faults details: indicates the type of occurred fault, locates the
instruction and the called function addresses.
- Bus Faults details: shows the status of bus errors resulting from
instruction fetches and data accesses and indicates memory access faults detected during a bus operation. An address should be displayed on the BFAR text field.
- Usage Faults details: contains the status for some instruction execution
faults, and for data access.
- Memory Management Faults details: indicates a memory access violation
detected by the MPU. If this fault was triggered by a faulty address, access is displayed on the MMFAR text field.
- CPU capture during exception: shows the CPU state when an exception was
generated to have an overview for CPU registers and some helpful information.
- NVIC position: indicates the number of the interrupt imposing the error.
If it is
-, the interrupt or exception vector has no specific position.
Execution mode: indicates the operation mode Handler or Thread.
- Stack memory region: indicates the used stack memory during the fault,
Main or Process stack.
Example 
Develop a simple application that generates a usage fault, set an instruction making a divide by zero, a non-permitted operation, in the main program function.
int a = 4, b = 0, c = 0c = a / b
Open the Fault Analyzer window, press the
Start


            Analysis
button to start
the fault detection algorithm, the reason of the error is displayed.
In this example, it displays
Hard


            Fault


            Detected
, and the label
divide


            by


            zero


            (DIVBYZERO)
is highlighted with additional information:
Faulty instruction address:
0x8000FF0- Faulty called function address:
0x8000D40, indicates the address calling the faulty instruction.
- Faulty called function address:
NVIC position:
0, window watchdog interrupt.Execution mode: handler.
Stack memory region: main stack.
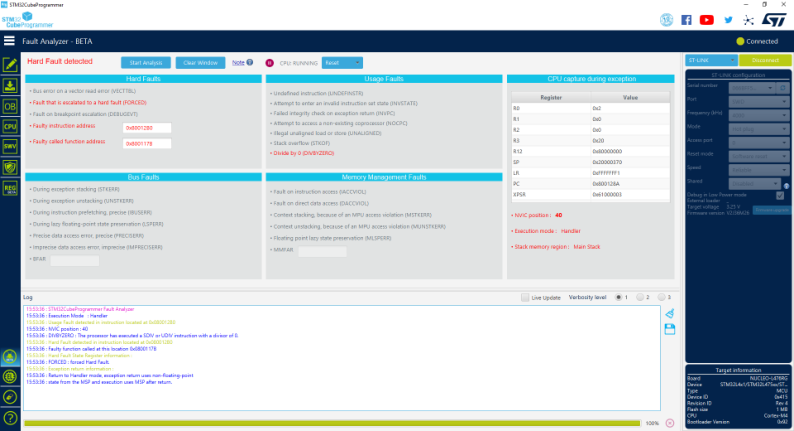
Fig. 56 Fault analyzer GUI view when Hard Fault is detected 
Fault analyzer note 
Fault analyzer can be unable to detect untracked faults not enabled by software.
The configuration and control register, CCR, controls the behavior of the Usage Fault for divide by-zero and unaligned memory accesses, and it is used mainly to control customizable fault exceptions.
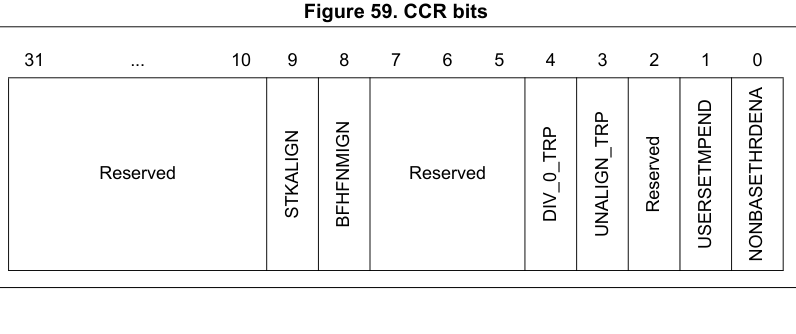
Fig. 57 CCR bits 
The following bits of the CCR control the behavior of the Usage Fault:
DIV_0_TRP: enable Usage Fault when the processor executes an SDIV orUDIV instruction with a 0 divider.
0= do not trap divide by 0; a divide by 0 returns a quotient of 0.1= trap divide by 0.
UNALIGN_TRP: enable usage fault when a memory access to unalignedaddresses is performed.
0= do not trap unaligned half-word and word accesses.1= trap unaligned half-word and word accesses; an unaligned accessgenerates a usage fault.
Note that unaligned accesses with
LDM,
STM,
LDRD, and
STRD
instructions always generate a usage fault, even when
UNALIGN_TRP
is set
to 0.
STM32CubeProgrammer enables the required bits at the analysis startup. If no fault is detected, an informative popup is displayed to indicate that you must reproduce the scenario and restart the analysis.
Secure Fault analyzer for Cortex-M33 
STM32CubeProgrammer provides information about security related faults for Cortex-M33 based devices for both CLI and GUI interfaces.
A new field named
Secure


            Faults
is added to Fault Analyzer window when
connecting a Cortex-M33-based device, such as an MCU of the STM32L5 series.
The result analysis is based on Secure Fault Status Register, SFSR, settings
and a fault is triggered if an error occurs:
INVEP: this bit is set if a function call from the nonsecure state orexception targets a non-SG instruction in the secure state. This bit is also set if the target address is a SG instruction, but there is no matching SAU/IDAU region with the NSC flag set.
INVIS: this bit is set if the integrity signature in an exception stackframe is found to be invalid during the unstacking operation.
INVER: set to 1 when returning from an exception in the nonsecure state.AUVIOL: attempt was made to access parts of the address space that aremarked as secure with NS-Req for the transaction set to nonsecure. This bit is not set if the violation occurred during lazy state preservation.
INVTRAN: indicates that an exception was raised due to a branch notflagged as being domain crossing causing a transition from secure to nonsecure memory.
LSPERR: indicates that an SAU or IDAU violation occurred during the lazypreservation of floating-point state.
SFARVALID: this bit is set when the SFAR register contains a validvalue.
LSERR: indicates that an error occurred during lazy state activation ordeactivation.
SFAR: indicates the address value when a secure fault is raised.